Financial oversight is one of the most critical responsibilities of a nonprofit board of directors, yet many boards fall short of optimum performance in this area.
Some aren’t sure where to start. Many don’t know how to gauge the financial health of their organization. Most are afraid that asking questions like: What 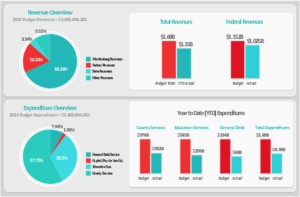 reports should we be looking at? or What questions should I be asking? will reveal their lack of understanding. So they keep quiet and pretend to understand.
Even if your organization produces monthly financial reports, understanding the implications of the data can be illusive for the very people who are charged with oversight. Creating a financial dashboard—reports that illustrate key pieces of data, often in a graphical format—can focus attention on the vital signs of a nonprofit’s fiscal well-being.
A recent article in Forbes gives some excellent pointers on how to develop a financial dashboard and how to use it for optimum decision-making. Graphs and visuals encourage storytelling, a sign of active interaction with the numbers.
Thoughtful financial analysis requires as many words as numbers. We encourage organizations to highlight meaningful variances — significant departures from budget — in financial reports. Variance analysis goes beyond identifying financial trends. A nonprofit’s management team needs to be able to explain variances to the board and other stakeholders and determine appropriate action. Seeing the numbers visualized prompts the question: “Why did we bring in less revenue than projected this quarter?” A practical conversation ensues: “Our income is actually highly seasonal. Should our revenue budget be modified to reflect this?”
Dashboards are effective tools for ensuring shared financial comprehension and engagement among board members.
Nonprofit boards are often a diverse crew of professionals not accustomed to being at the same table: they may range from private sector finance heavyweights to social sector types. Given the varied governance responsibilities of a nonprofit board, a healthy tension among perspectives is inevitable, but it can be a tricky dynamic to manage.
Dashboards create a common language between board members, allowing those inclined to pour over the financials to communicate with those less driven by financial data. Dashboards also convey to the board the level of information that is expected — and appropriate — for them to be familiar with.
The process of developing a dashboard can help define measures of success.
Leaders of dynamic nonprofit organizations move fast. When faced with time-sensitive decisions — about things like funding, program changes, and partnerships — it helps to have a shared understanding of the organization’s priorities and measures of success. By coming together to design a concise reporting tool, organizational leaders are forced to make choices — simply because you can’t pay attention to everything at the same time.
If any of the above sounds familiar, then a dashboard may be a useful tool for your organization. Developing the dashboard report in a thoughtful and inclusive way is essential, in order for the tool to be accepted and used by decision-makers across the organization.
Here are five pointers to help get you started:
>>Create a diverse working group to identify what matters to your organization.
One of my clients, a growing youth-services organization, assembled a dashboard project team comprised of leaders from finance, development, and programs. The team brainstormed valuable metrics from their respective functional areas to track over time. This wish-list was progressively brought into focus. By the end, the group had settled on a dozen metrics that they agreed the organization needed to pay attention to in order to succeed.
While this short-list of measures will vary by organization, here are a few standard areas that we recommend tracking: (1) operating results for the organization and major programs; (2) strength of balance sheet measures, particularly liquidity; (3) fundraising performance; and (4) program outcomes tied to your theory of change.
>>Measure performance against a desired target.
Displaying targets alongside actual performance on a graph helps tell an interesting story about different parts of an organization: revenues, expenses, program results. Setting targets is an exercise informed by historical data and intuition. A good place to start is the current fiscal year’s operating budget. As you reforecast and adjust your budget, update your dashboard’s targets accordingly.
>>Pilot the dashboard for a set time, then reevaluate.
Dashboards are only as useful as their applications. It can be tempting to stay in perpetual R&D mode to arrive at the perfect set of metrics, but you miss out on valuable user feedback.
Another data-savvy client, a food justice organization, committed to piloting their dashboard for a full year. They identified strategic questions for each graph to guide the conversation. For example: Do year-to-date trends in budget-versus-actual performance align with seasonality and timing expectations? How does the number of people served relate to impact goals for each program area?
>>Build a dashboard that you can maintain.
There are many options for building dashboard reports: ranging from Microsoft Excel to systems like Intacct or Salesforce. An automated dashboard on a specialized software platform may seem ideal, but you can develop perfectly functional dashboard reports in Excel.
Rather than over-engineering your dashboard, prioritize a tool that will be painless for you to update on a monthly or quarterly basis.
This sample dashboard from CompassPoint is a good example of how relatively simple dashboards can be highly effective decision-making tools.
Over the past ten years, dashboards have emerged in nonprofit parlance as a “best practice” for financial management. They are not a fix-all, but if financial reporting feels like an administrative, rote exercise at your organization, then a dashboard may be just the thing to energize internal discussions around finances.